SIR epidemic simulation
A numerical simulation of how COVID-19 could spread through Karaganda, Kazakhstan, using the SIR model and Euler's method written from scratch.
- When
- Spring 2026
- Stack
- Python, NumPy, Matplotlib, Jupyter
The model
The population is split into three groups: susceptible S, infected I, and removed R.
dS/dt = -b·S·I / N
dI/dt =  b·S·I / N - k·I
dR/dt =  k·I
b is the infection rate and k the removal rate. The equations have no closed-form solution, so the solver steps them forward one day at a time: next value = current value + step × derivative.
Parameters
| Parameter | Value | Source |
|---|---|---|
| Population | 500,000 susceptible, 3 infected | Approximate size of Karaganda |
Infection rate b |
0.17 | Mean transmission rate for Karaganda in Koichubekov et al. (2023) |
Removal rate k |
0.04 | Baseline choice |
| Step size | 1 day |
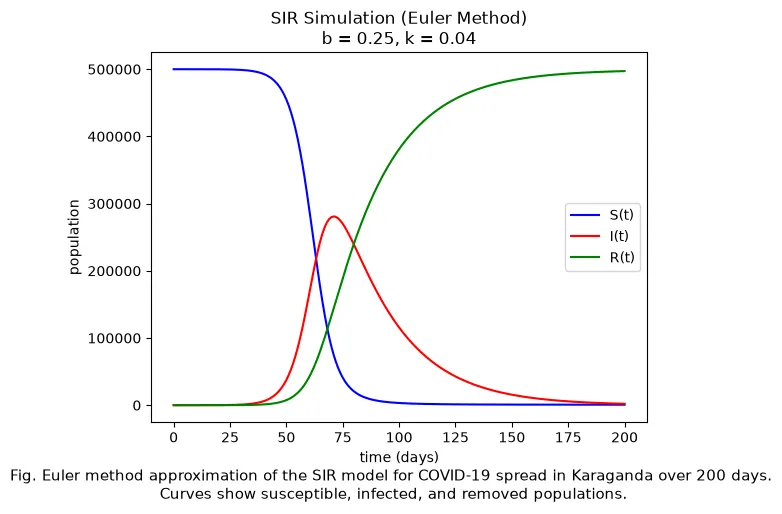
The reported standard deviation of b is 0.075, so I also ran b = 0.10 and b = 0.25 to cover roughly one standard deviation either side, and k = 0.02 and k = 0.06 to see the effect of slower and faster removal. That gives five scenarios in total.
What it shows
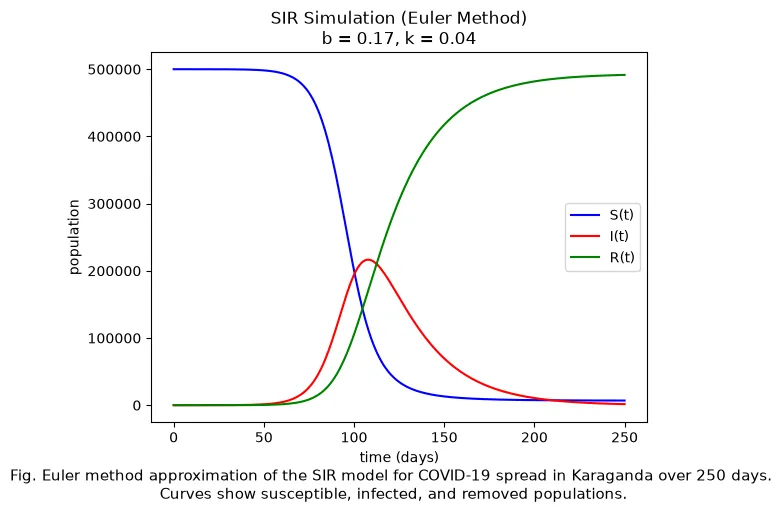
A higher infection rate gives an earlier and taller peak of infections. A higher removal rate lowers and flattens the peak, and leaves more of the population never infected.
The baseline run:
The higher infection rate, b = 0.25:
Assumptions and limits
- Everyone mixes with everyone equally. There are no households, ages, or districts.
bandkstay constant, so lockdowns, vaccination, and behaviour change are not modelled.- The population is fixed: no births, deaths from other causes, or travel.
- Euler’s method with a one-day step is a first-order approximation. A smaller step or a higher-order method would track the true solution more closely.
Reference
Koichubekov, B., Takuadina, A., Korshukov, I., Turmukhambetova, A., & Sorokina, M. (2023). Is it possible to predict COVID-19? Stochastic system dynamic model of infection spread in Kazakhstan. Healthcare, 11(5), 752.